How to Track Social Media Analytics: A 2026 Playbook
You're probably already tracking something. Likes on Instagram. Views on TikTok. Follower growth on LinkedIn. Maybe a few screenshots in a folder you swear you'll turn into a report later.
That's where most social media analytics break down. The data exists, but it isn't organized, comparable, or tied to what the business needs. You can tell a post “did well,” but you can't say whether social is driving traffic, leads, or demand.
A professional analytics system fixes that. It turns scattered platform numbers into a decision-making workflow. Instead of checking dashboards out of habit, you start using data to answer practical questions: Which channel sends qualified traffic? Which content format earns attention and action? Which campaigns deserve more budget, effort, or repetition?
Table of Contents
- Stop Drowning in Data Start Tracking What Matters
- Start with the business outcome
- Map each goal to a KPI category
- Build a KPI table you can actually use
- Use UTMs on every meaningful link
- Make your naming system boring and consistent
- Track what happens after the click
- Read metrics in platform context
- What to watch on each major platform
- Judge traffic quality after the click
- Choose the right dashboard model
- Decide what belongs on one screen
- Set a reporting cadence you will keep
Stop Drowning in Data Start Tracking What Matters
Most creators and marketers don't have a data problem. They have a signal problem.
Social platforms give you a flood of numbers, but not much clarity. One post gets comments. Another gets reach. A third drives clicks. If you don't have a system, you end up rewarding whatever is easiest to see. Usually that means vanity metrics. Follower count, likes, and raw views get all the attention, while the metrics that shape revenue stay buried.

That's why learning how to track social media analytics matters. The point isn't to build prettier reports. It's to build a workflow that tells you what's worth doing again, what needs fixing, and what isn't helping the business.
A lot of teams stay stuck at the post level. They check platform dashboards one by one and react to whatever happened that day. A better approach is to centralize the important metrics, compare them across channels and time periods, and map them back to business goals. If you want a good primer on that broader shift, SuperX for data-driven decisions is a useful companion read.
Practical rule: If a metric can't influence a decision, it doesn't belong in your main dashboard.
The good news is that the system isn't complicated once you strip it down. You need goals, clear KPIs, dependable tracking, one place to review results, and a rhythm for acting on what you find. Get those five pieces right, and social analytics stop feeling like admin work and start becoming part of growth.
Foundation First Define Your Goals and KPIs
The fastest way to waste time in analytics is to open a dashboard before you've decided what success means.
A reliable social media analytics workflow starts by aligning KPIs to business outcomes, then standardizing campaign tagging and link parameters so results can be tied to traffic, conversions, and channel performance. Brandwatch also recommends consistent naming across platforms, unified dashboards, and weekly data-quality checks to catch tracking breaks, metric discrepancies, and unusual spikes or drops before they distort reporting, as noted in its guide to social media analytics workflow practices.
Start with the business outcome
“Grow on social” isn't a goal. It's a vague wish.
Real goals look more like this:
- Generate leads: Social should drive people to book a call, join an email list, or request a demo.
- Build awareness: More of the right audience should see and remember the brand.
- Strengthen trust: Content should earn replies, saves, shares, and repeat attention.
- Support sales: Social should help move buyers toward a purchase decision.
When the business goal is clear, picking metrics gets easier. You stop asking, “What can this platform measure?” and start asking, “What evidence would prove progress?”
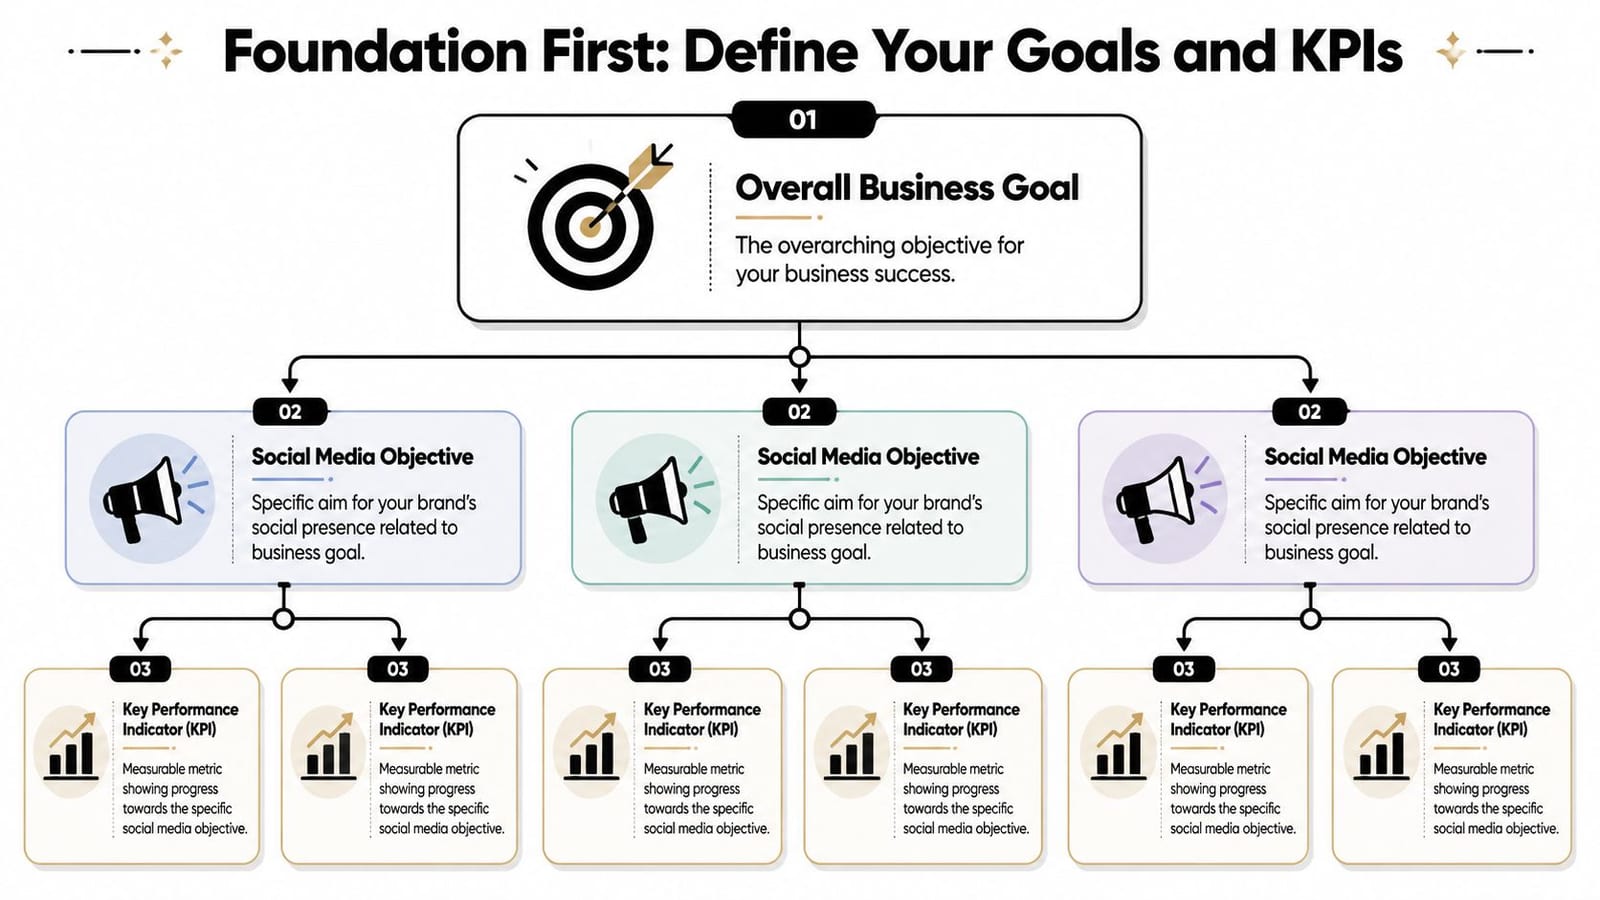
Map each goal to a KPI category
Teams commonly organize social KPIs into three buckets.
Awareness metrics tell you whether people are seeing you.
Engagement metrics tell you whether the content is resonating.
Conversion metrics tell you whether social is creating downstream action.
If you need a sharper breakdown of top-of-funnel visibility metrics, Moonb's guide to essential metrics for creative teams helps clarify where reach and impressions fit.
The strongest KPI sets are small. A focused set beats a bloated dashboard every time.
Build a KPI table you can actually use
Here's a simple operating table that works for most brands.
| Business goal | Social objective | KPIs to track |
|---|---|---|
| Build brand awareness | Increase visibility with the right audience | Impressions, unique reach, follower growth rate, share of voice |
| Grow audience engagement | Publish content people actively respond to | Likes, comments, shares, saves, click-through rate |
| Drive website traffic | Get social users onto owned channels | Click-through rate, sessions from social, users from social, average engagement time per session |
| Generate leads or conversions | Tie social activity to business actions | Session conversion rate, conversions, event count |
| Improve campaign reporting | Compare channels and content consistently | Cross-platform engagement metrics, reach metrics, campaign-tagged traffic |
A few rules keep this useful:
- Choose primary KPIs: Pick the handful that directly represent success.
- Add diagnostic KPIs: Use supporting metrics to explain why results moved.
- Separate platform metrics from business metrics: A post can perform well in-platform and still fail to drive outcomes.
- Define each metric once: Teams argue less when everyone uses the same definitions.
If you want a practical checklist for choosing and organizing what matters, this social media metrics checklist is a helpful reference.
What doesn't work is tracking everything because the data exists. That creates noise, not insight. The best KPI systems are selective, boring, and easy to review quickly.
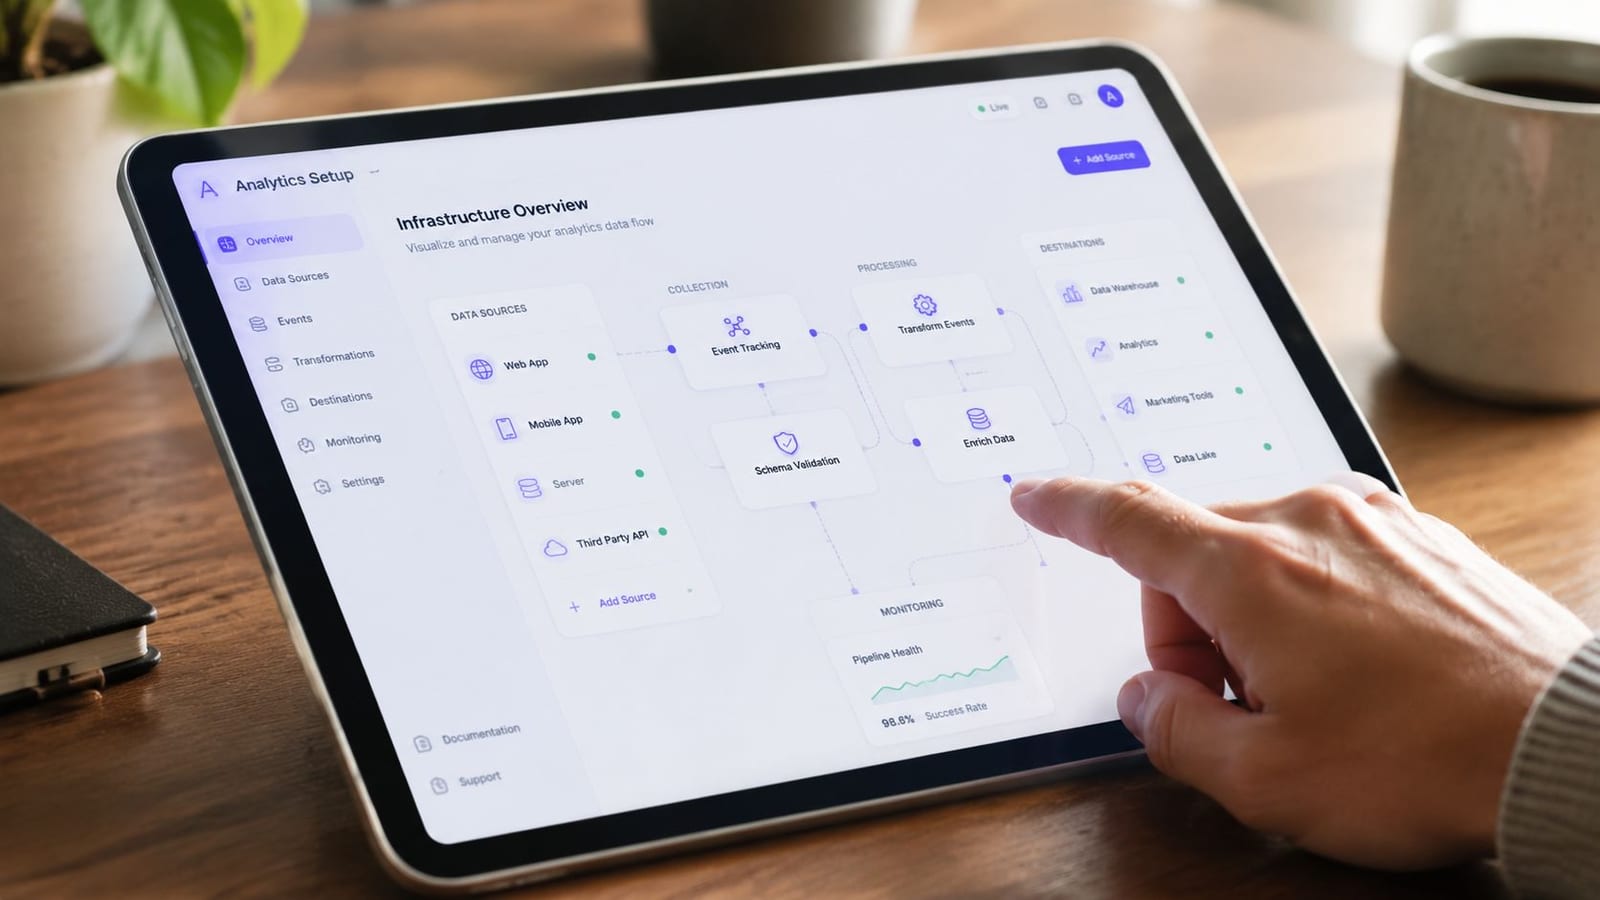
Set Up Your Tracking Infrastructure
Once your goals and KPIs are set, the next job is plumbing. This is the part often neglected, resulting in subsequent bewilderment regarding one's inability to prove impact.
The basic infrastructure has two jobs. First, it must identify where traffic came from. Second, it must capture what happened after the click. If either part is missing, your reporting will always have gaps.
Use UTMs on every meaningful link
This is the essential piece.
Worcester State University notes that UTM tracking is the best way to measure social media referral traffic because adding UTM codes to shared URLs lets marketers see exactly how much website traffic comes from social channels, posts, and ads in Google Analytics, which is why its social media analytics guide treats it as foundational.
Without UTMs, traffic from social turns muddy fast. You might know people came from a platform, but not which campaign, which post, or which creative angle drove the visit.
A simple UTM template usually includes:
- Source: The platform, such as Instagram, LinkedIn, or TikTok
- Medium: The traffic type, such as social or paid_social
- Campaign: The campaign or content theme
- Content: The creative variation, hook, or asset name
A clean example would look like this in practice:
- Source: instagram
- Medium: social
- Campaign: spring-webinar
- Content: reel-hook-a
You don't need fancy naming. You need naming that stays consistent month after month.
Make your naming system boring and consistent
Messy UTM naming ruins analysis. If one person tags a campaign as “Launch_April” and another uses “april-launch,” your reports split the same effort into separate rows.
That's why teams need a naming convention before they publish. Keep it lowercase. Avoid spaces. Decide how you'll name platforms, campaigns, content variants, and paid versus organic traffic. Then document it somewhere everyone can copy.
A simple rule set helps:
- Use one platform label per channel. Don't alternate between “ig,” “instagram,” and “insta.”
- Use one medium format. If you use
social, keep usingsocial. - Name campaigns by business initiative. Product launch, webinar, newsletter push, evergreen lead magnet.
- Use the content field for testing. Hook A, creator clip, carousel version, founder video.
Tracking breaks rarely happen because analytics tools fail. They happen because teams publish links with inconsistent labels.
Track what happens after the click
Traffic is useful, but traffic alone doesn't tell you whether social is doing meaningful work.
You also need site-side conversion tracking. That usually means setting up the relevant platform pixel or events framework for your ad channels, plus making sure your site analytics can register actions like signups, lead submissions, purchases, or key engagement events.
The practical point isn't the tool choice. It's visibility. You want to know whether a post brought visitors who bounced, explored, subscribed, or converted.
A healthy setup usually includes:
- Website analytics: To see sessions, users, engagement, and conversions from social traffic
- Conversion events: To capture actions such as form fills, purchases, or key clicks
- Platform-side tracking: To support paid optimization and remarketing where relevant
- Regular QA checks: To verify tags still work after landing page edits, CMS updates, or campaign launches
What doesn't work is relying only on in-platform metrics like impressions and likes. Those tell part of the story. They don't tell you whether social contributed to business results.
Master Platform-Specific Metrics
A creator posts the same message on Instagram, LinkedIn, and TikTok, then opens analytics the next day and sees three very different outcomes. Instagram shows strong saves. LinkedIn gets fewer reactions but more profile visits. TikTok racks up views with almost no clicks. If all three posts get judged by the same metric, the wrong channel gets the budget and the wrong content gets repeated.
That is why platform-specific analysis matters. Cross-platform reporting helps you see the whole program, but native behavior still has to be interpreted on each platform's terms. A save on Instagram signals something different from a repost on LinkedIn. A video view on TikTok is a weaker business signal than a click to a webinar page from LinkedIn. Good analytics systems account for that difference instead of flattening everything into one engagement rate.
Read metrics in platform context
Use one question for every channel: what action shows that the content is doing its intended job here?
That sounds simple, but it fixes a common reporting problem. Teams often reward the most visible metric because it is easy to screenshot. Views, impressions, and likes are useful top-line signals. They are also easy to overvalue. If the goal is brand recall, reach may matter most. If the goal is trust, saves, shares, comments, and return visits often tell a better story. If the goal is pipeline, qualified clicks and conversion behavior matter more than public engagement.
I use a practical hierarchy. Start with the metric that matches platform behavior. Then pair it with one business-facing metric so the channel does not get optimized in a vacuum.
What to watch on each major platform
Instagram
Track reach, saves, shares, comments, profile actions, and post-level clicks. Saves usually signal utility. Shares often signal relevance or identity. Reels may earn broad reach, while carousels often produce stronger saves and longer-term value. For teams that need cleaner reporting across content and account activity, Instagram analytics integrations can reduce manual exports.
Facebook
Focus on reach, comments, link clicks, and the quality of traffic Facebook sends to your site. Facebook can still work well for community interaction and content distribution, especially if you publish links, videos, and discussion posts for an existing audience.
TikTok
Watch time, completion rate, repeat views, shares, profile visits, and link-in-bio actions matter more than raw view count. TikTok is strong at generating attention, but attention alone does not prove business impact. Archive your numbers outside the platform if you want trend analysis over longer periods, because native reporting windows can be limited.
YouTube
Prioritize watch time, audience retention, click-through rate on thumbnails and titles, and conversions tied to video traffic. YouTube often gives a clearer read on topic fit because viewers spend more time with the content. A video with fewer views but stronger retention and better downstream conversions usually deserves more attention than a high-view video with weak watch time.
LinkedIn
Track shares, comments, follows, profile visits, and clicks from posts aimed at decision-makers. LinkedIn usually produces lower engagement volume than entertainment-first platforms, but the intent can be much higher. For B2B creators, one post that drives qualified traffic to a case study can outperform a month of broad awareness content elsewhere.
X
Monitor replies, reposts, link clicks, post reach, and engagement by topic or format. Timing matters here more than on many other platforms. So does repetition. Strong performance often comes from consistent coverage of a narrow set of topics rather than one-off posts.
Pinterest
Treat Pinterest as a search and discovery channel. Outbound clicks, saves, impressions, and long-tail traffic patterns matter more than conversation metrics. Pins can keep sending traffic long after publication, so short reporting windows can understate value.
Compare platforms by job. Instagram may build recall. LinkedIn may drive qualified traffic. YouTube may convert high-intent viewers. Those outcomes should not be graded on the same scale.
Judge traffic quality after the click
Native dashboards show what happened on-platform. Site analytics show whether the visit was worth anything.
Review social traffic in GA4 by source and medium, then compare sessions, engagement rate, average engagement time, key events, and conversion actions by platform. Add a device breakdown if mobile traffic behaves differently from desktop traffic, which is common for social. This analysis exposes a trade-off that busy creators miss all the time. The channel with the most visits is often not the channel producing the best visitors.
That distinction matters in real planning. If Pinterest sends fewer sessions but stronger on-site engagement, keep investing. If TikTok drives large traffic spikes with weak conversion behavior, treat it as an awareness channel and adjust expectations. Platform metrics tell you how content performed inside the network. Business metrics tell you whether that performance translated into traffic, leads, or sales.
Build Your Consolidated Dashboard and Reporting Rhythm
Monday morning usually starts the same way. You open Instagram Insights, then TikTok Analytics, then LinkedIn, then GA4, and twenty minutes later you still do not have one clear answer about what social is doing for the business.
That is the point where individual dashboards stop being useful. A working analytics system pulls the right numbers into one place, keeps the definitions consistent, and makes review fast enough that the team will do it. The value is not cleaner reporting for its own sake. The value is faster decisions about where to spend time, what to publish more often, and which channels are producing traffic, leads, or sales.
Choose the right dashboard model
Start with one question. Who needs to use this dashboard every week?
If the answer is just you, a spreadsheet is often enough at first. If multiple people need to review performance, comment on results, and spot trends quickly, a more structured setup usually saves time. The right model depends less on company size and more on reporting complexity, number of channels, and how often you need to explain results to clients, leadership, or collaborators.
| Dashboard approach | What it's good for | Trade-off |
|---|---|---|
| Manual spreadsheet | Low-cost starting point, full control over definitions | Time-intensive, easy to break, hard to scale |
| BI or visualization tool | Flexible reporting and custom analysis | More setup, steeper learning curve |
| Integrated social platform | Faster consolidation across publishing and analytics workflows | Depends on integrations and platform fit |
Spreadsheets are useful early because they force clear thinking. You have to decide which metrics belong in the report, how each one is defined, and which sources matter. I still recommend them for solo creators who are building their first reporting habit. The downside shows up fast once you add more platforms, more campaigns, or client reporting. Manual entry creates version problems, skipped weeks, and inconsistent calculations.
BI tools are a better fit when you need custom views across channels, campaigns, and website performance. They also ask more from whoever maintains them. If no one on the team wants to manage connectors, field mapping, and report logic, the dashboard will gradually go stale.
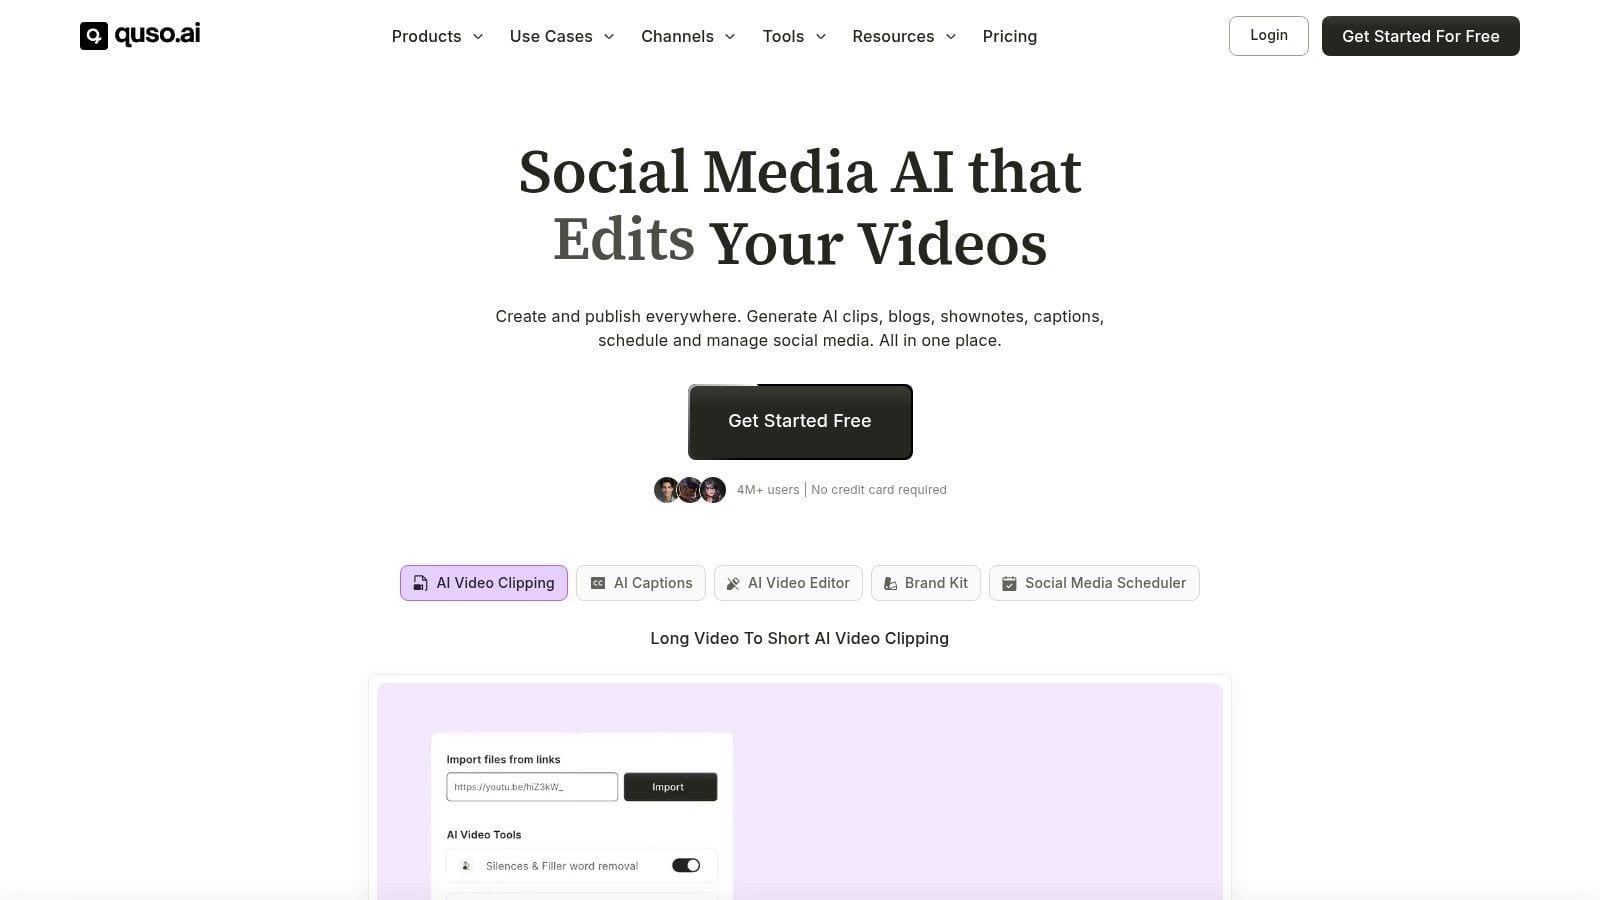
Integrated tools sit in the middle. They reduce admin work by keeping publishing and analytics closer together, which matters if speed is more important than custom modeling. If you need a starting point for the structure itself, this social media performance report template guide gives you a practical format to build around. quso.ai can also connect planning, publishing, and analytics across multiple channels, which is useful for teams that want fewer handoffs.
The best dashboard is the one people can maintain without heroics.
Decide what belongs on one screen
A consolidated dashboard should answer three business questions quickly:
- Are we reaching the right audience?
- Is content creating meaningful action?
- Is social contributing to traffic, leads, or revenue goals?
That means the dashboard needs a mix of platform metrics and business metrics, not a long export of everything each network provides. In practice, a strong summary view usually includes channel, content format, impressions or reach, engagement rate, clicks, CTR, sessions, conversions, and a short note on top-performing content themes. Add spend and cost metrics if paid social is part of the mix.
Keep the executive view tight. Put diagnostic detail on separate tabs or secondary views. If one report tries to serve every possible question, nobody can scan it quickly.
Set a reporting cadence you will keep
Reporting rhythm matters as much as dashboard design. Earlier guidance from Worcester State University supports setting a regular schedule and archiving results so you can review trends over time instead of relying on scattered snapshots.
A simple operating cadence works well for most creators and small teams:
- Weekly: Check posting consistency, top content, click-through trends, traffic spikes, and tracking problems.
- Monthly: Compare channels, review content themes, assess traffic quality, and measure conversions against goals.
- Quarterly: Revisit KPIs, adjust channel roles, and make resource decisions based on patterns instead of isolated wins.
Each review has a different job. Weekly reporting catches issues while they are still fixable. Monthly reporting shows whether content is delivering results. Quarterly reporting is where strategy changes should happen, because by then you can usually separate a real pattern from a short-term spike.
This is a useful walkthrough of what a more automated workflow can look like:
Ad hoc reporting creates predictable problems. Teams pull numbers only before meetings, compare mismatched date ranges, and spend more time explaining the report than using it. A set dashboard and review rhythm fixes that. It turns social analytics from a scramble into an operating system.
From Data to Decisions How to Iterate and Improve
Good analytics don't end in a dashboard. They end in a better next move.
The simplest operating loop is this: analyze, form a hypothesis, test, then measure again. If short educational videos drive saves but not clicks, test a stronger call to action. If LinkedIn sends fewer visits but better on-site engagement, publish more decision-stage content there. If one campaign gets attention without conversions, fix the offer or landing page before blaming the platform.
A few decision patterns come up often:
- Double down on efficient formats: Keep the formats that repeatedly earn meaningful engagement or qualified traffic.
- Refine weak posts, don't just discard them: Sometimes the topic is right and the packaging is wrong.
- Pause channels that consume effort without evidence: Not every platform deserves equal energy.
- Review anomalies quickly: Spikes and drops can come from content, timing, broken tracking, or platform shifts.
Analytics should change behavior. If nothing changes after the report, the report wasn't useful.
Many teams mature by shifting their focus. They stop asking, “How did that post do?” and start asking, “What did that result teach us?” This approach is the primary benefit of learning how to track social media analytics properly. You spend less time gathering numbers and more time improving the work.
If you want one place to handle planning, publishing, and analytics together, quso.ai is worth a look. It supports connected social workflows across major platforms and gives creators and teams a practical way to track performance without stitching together separate tools for every step.